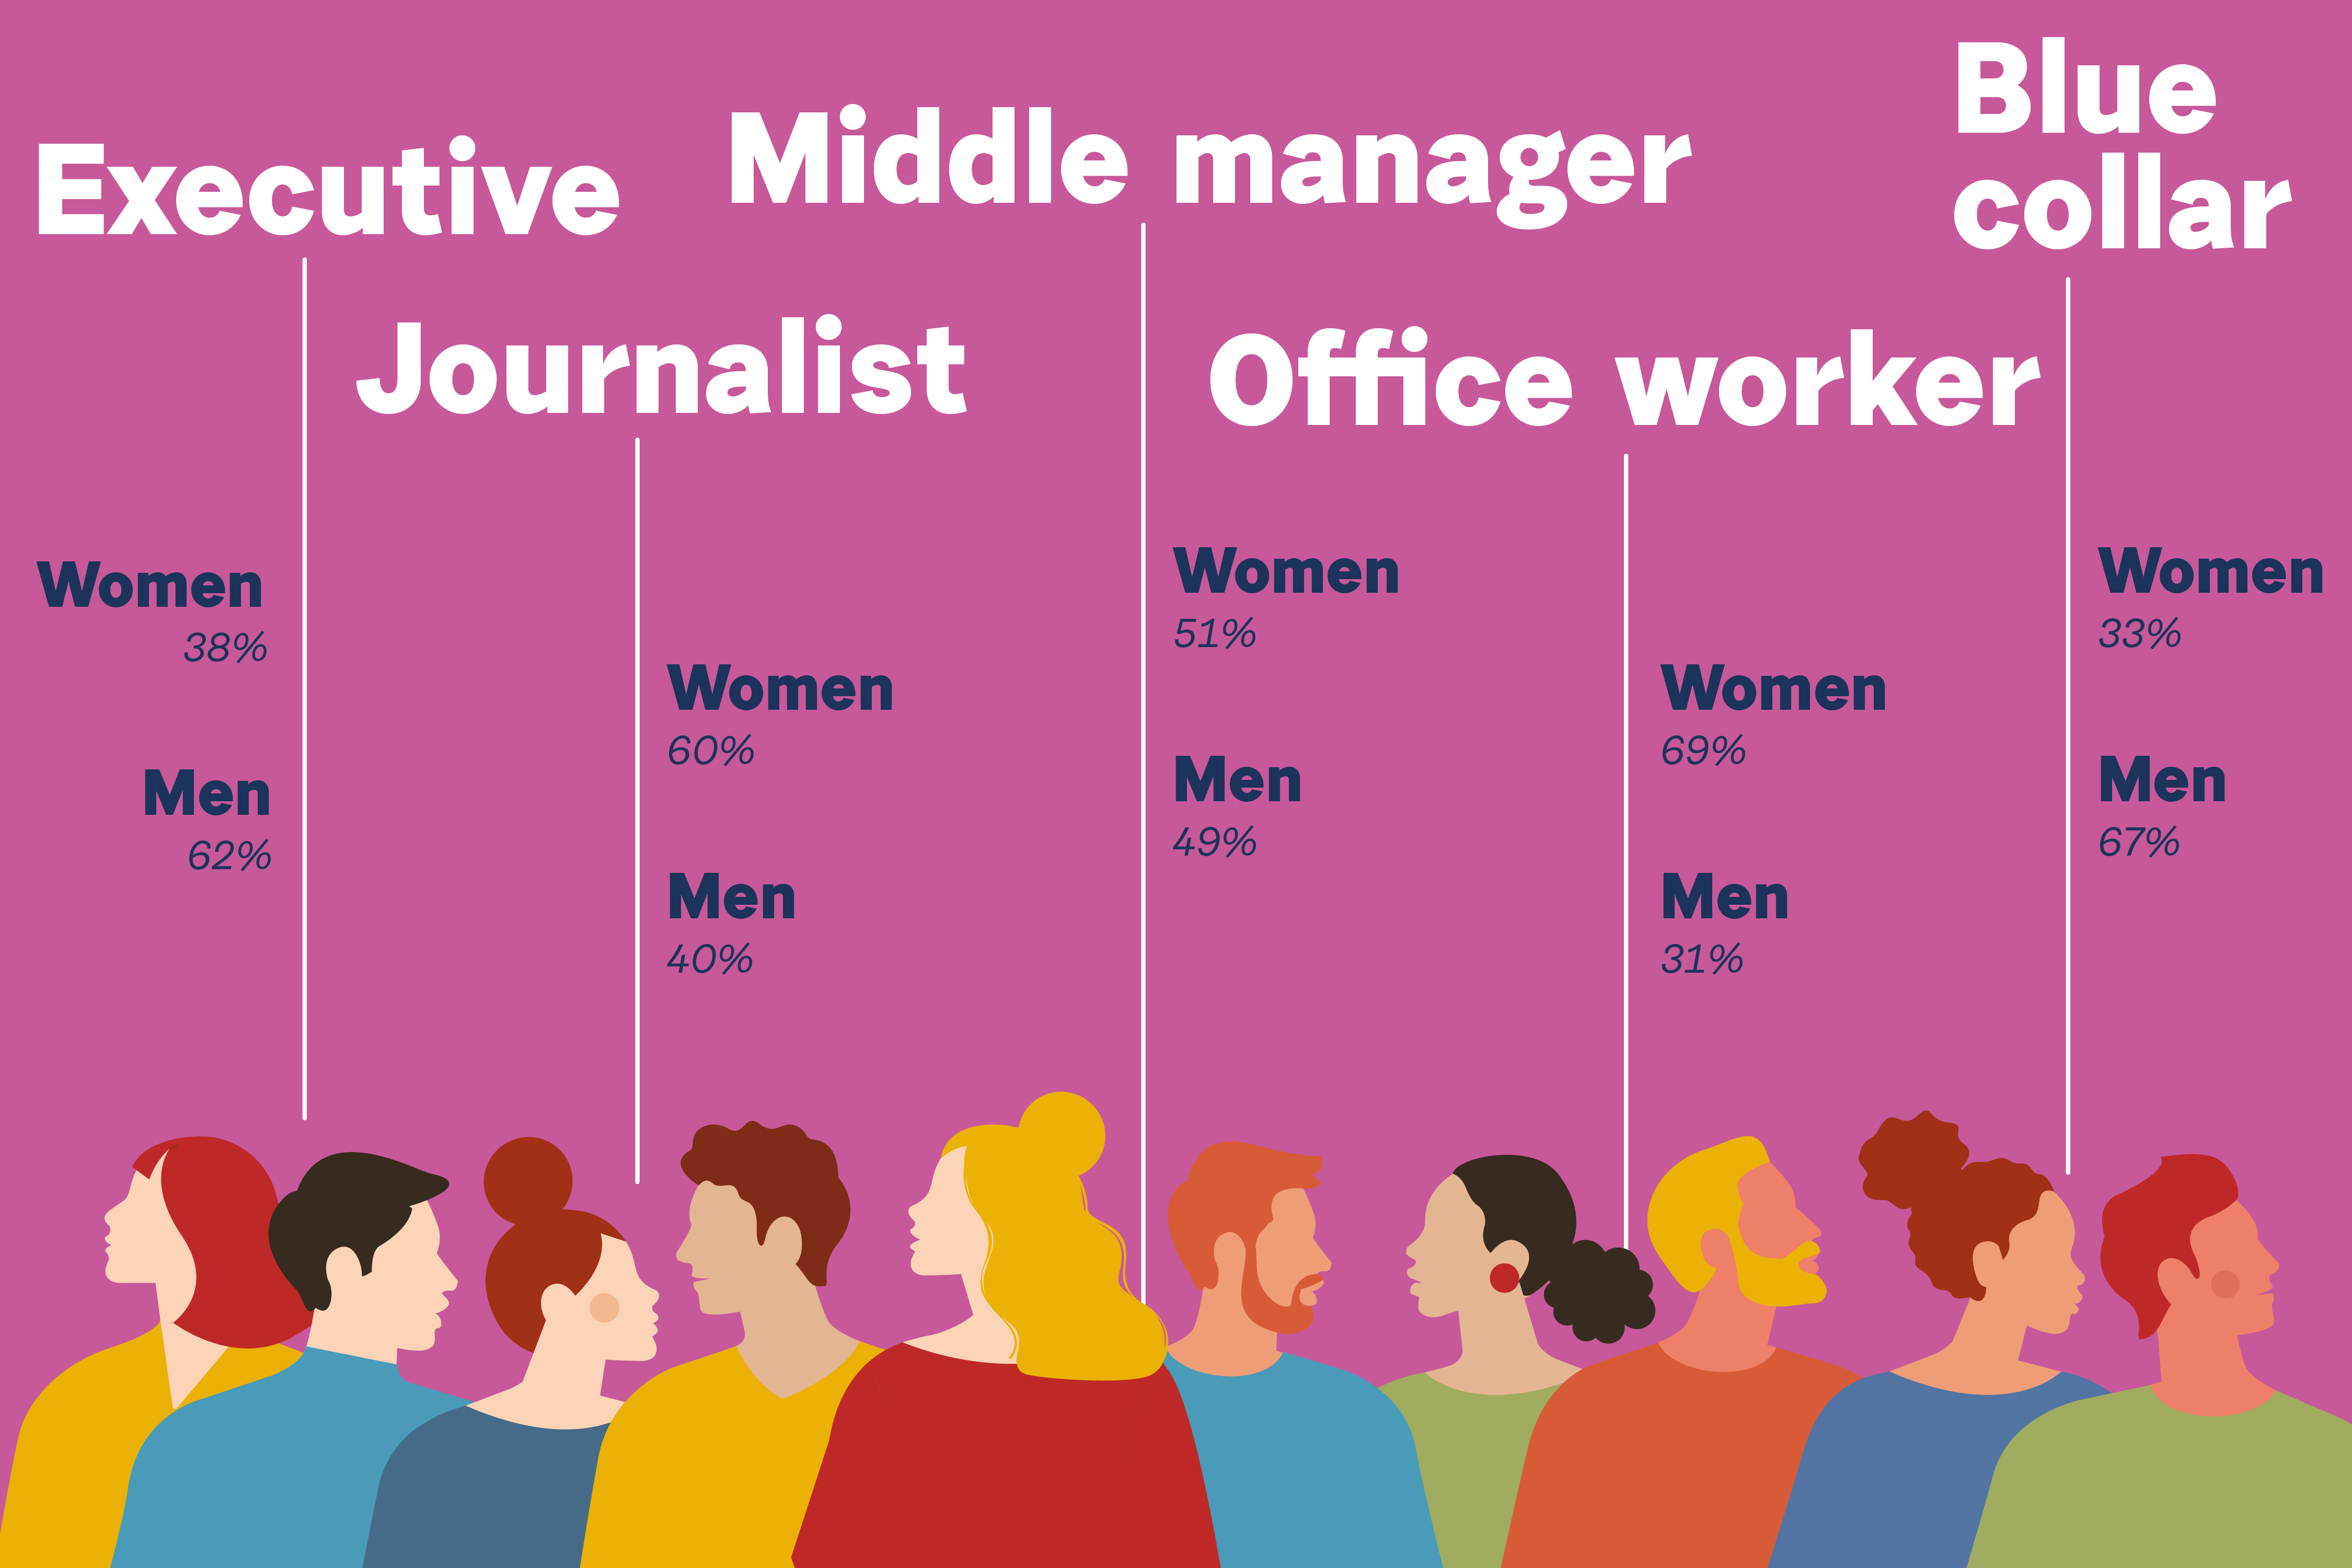
Personnel breakdown by position and gender
| 2022 | | | 2021 | | | 2020 | | |
|---|
| % of total | of which women | of which men | % of total | of which women | of which men | % of total | of which women | of which men |
|---|
| Executives | 5% | 36% | 64% | 5% | 31% | 69% | 5% | 29% | 71% |
| Middle managers | 14% | 51% | 49% | 14% | 55% | 45% | 14% | 55% | 45% |
| Office workers | 74% | 68% | 32% | 71% | 67% | 33% | 71% | 66% | 34% |
| Journalists | 6% | 66% | 34% | 9% | 73% | 27% | 9% | 73% | 27% |
| Blue collars | 1% | 29% | 71% | 1% | 29% | 71% | 1% | 20% | 80% |
| Total | | 63% | 37% | | 64% | 36% | | 63% | 37% |
Women on the Board of Directors
| 2022 | | | 2021 | | | 2020 | |
|---|
| women | men | total | women | men | total | women | men | total |
|---|
| 42% | 58% | 12 | 42% | 58% | 12 | 36% | 64% | 14 |
Employees with disabilities
| 2022 | | | 2021 | | | 2020 | | |
|---|
| % of total employees with disabilities | of which women | of which men | % of total employees with disabilities | of which women | of which men | % of total employees with disabilities | of which women | of which men |
|---|
| Middle managers | 6% | 75% | 25% | 5% | 75% | 25% | 5% | 75% | 25% |
| Office workers | 87% | 44% | 66% | 85% | 47% | 53% | 84% | 47% | 53% |
| Journalists | – | – | – | 1% | 100% | – | 4% | 100% | – |
| Blue collars | 7% | 20% | 80% | 8% | 33% | 67% | 8% | 33% | 67% |
| % of total employees | of which women | of which men | % of total employees | of which women | of which men | % of total employees | of which women | of which men |
|---|
| 3% | 46% | 54% | 4% | 48% | 52% | 4% | 49% | 51% |